If not, what are your deviations?
by Philip D. Welsby (November 2025)
Averages, the adding up of numerical results from a population or data set divided by the number in that population, are the most frequently used statistics because they are deceptively simple. Unfortunately, they are frequently misunderstood or misinterpreted. Notably, averages may give no indication of the spread of results. Sometimes an average is confused with the median (the middle value when the numbers are arranged in order) or confused with the mode (the value than occurs most often). It is striking that well over 50 percent of people consider themselves to be above average. Although statistically not impossible this reveals potential flaws in any self-reported attributes. For a full appreciation visual Distribution Curves are often required.
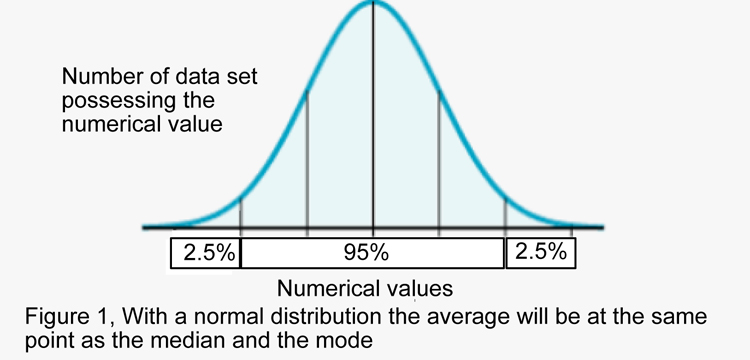
For most, but not all, biological parameters capable of numerical quantification, the curve will be a Normal “bell-shaped” Distribution Curve (NDC) in which data is symmetrically distributed (Figure 1). For NDCs the statistical convention is that 95 percent of values lie within two standard deviations of the average (the standard deviation tells you, on average, how far individual values are from the mean) and the 2.5 percent within each lateral tail are conventionally considered as being outwith acceptable limits and are thus “abnormal.” It is interesting that “normality” is defined in terms of deviations! Some distribution curves are not bell shaped but are bimodal. For example, male versus female heights, such that a contributor of the average height, might be relatively rare. Some distributions, such as incomes, may be skewed. With skewed distributions, it is possible for a majority to be above or below an average, particularly if there are a number of outliers. Some distributions are categorical. Other distribution include exponential distributions such as survival times (that decline with age). Poisson distributions that show whether events may or may not occur within a defined time interval, and Bernoulli distributions demonstrate events with a single alternative outcome such, as flipping a coin.
Some human attributes present in human populations are difficult to assess numerically and include political opinions, individual ambitions, insight possession, mental energy, self-belief, and desire for control and power, all of which I suggest probably have bell shaped or skewed distributions, such that 2.5 percent are at the opposite tail ends and, statistically, are “abnormal.”
Predictably and worryingly, those who occupy the 2.5 percent positive tails of their NDCs will, for better or worse, be distinctive and, sometimes with reason, conclude they are more distinguished, and therefore likely to consider themselves best suited to be leaders of those with less distinguished 95 percent attributes. They will tend to consider themselves to be above average (never below!) in many attributes and thus “better.” The “normal” 95 percent may not agree but confusing opinions “interpretations of facts” are often coming at them from both the “abnormal” 2.5 percent tail ends of the spread of opinions on various topics..
Even more worrying, those in tails may not realize that they are “abnormal.” Some multiple tail enders achieve success because they lack social skills possessed by the 95 percent such that they have to be aggressively ambitious and have to strive to achieve control and power, otherwise no one would give them the time of day.
The “normal” 95 percenters will mostly be happy with their situation and will not make significant impacts on those in “abnormal” tail ends. Indeed, about 30 percent of those entitled to vote in elections do not vote. Many do not wish to strive to attain high office with all the attendant stresses, especially when statistically most will be fail in their striving.
What can the middle-of-the-road majorities, those in only one or two NDC tail attributes, do to deal with leaders who possess multiple tail attributes and possible abilities? Presenting both sides of an issue may be magnanimous but sadly offers those whose opinions are predecided the opportunity to selectively criticise whichever side they disfavour. If the 95 percent of “normals” fight fire with fire, this reduces them to the level of the 2.5 percenters, and those in power have more motivation and have experience functioning at that level. Also fighting fire with fire with revolutions often ensconces new leaders with similar control and power tail end attributes of those they displace or overthrow.
What is the solution? Individuals within the 95 percent must strive to achieve democracy by actually voting and realising and pointing out that those who do not vote are neglecting their civic duty. Such actions will be unpopular and difficult to sustain against popularists who promise to the 95 percent that they can deliver what they want, no matter how unrealistic this may be.
Table of Contents
Philip Welsby was a Consultant Physician in Edinburgh, probably one of the last general physicians because he looked after children and adults. He has published widely on medical, political, musical, and humorous aspects of modern life. He is an associate editor of the Postgraduate Medical Journal.
Follow NER on Twitter @NERIconoclast